
Market Volatility Rising Amid Conflict in Iran
Geopolitical risk, tax‑season liquidity pressures, and rising policy uncertainty are testing investor confidence (and muddying the economic outlook) even as market behavior continues to track historical presidential‑cycle patterns.
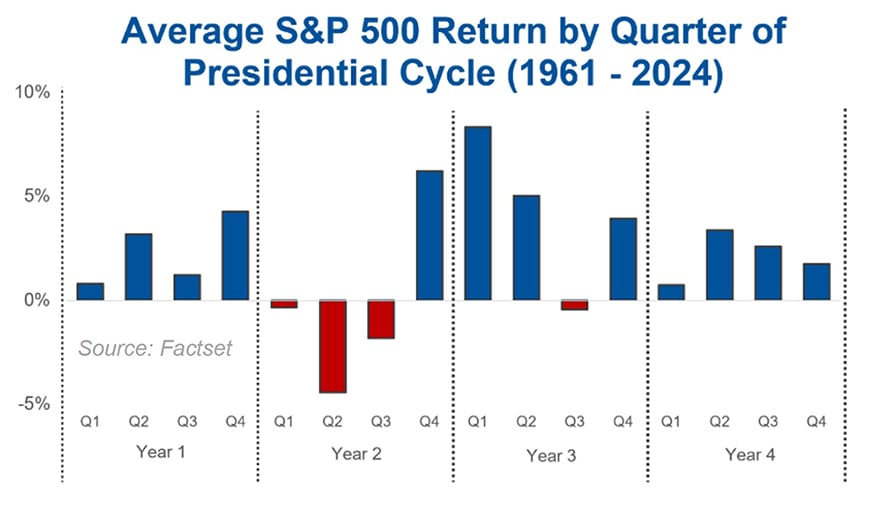
Uncertainty abundant. The U.S.-Iran conflict has entered its fifth week, which also coincides with the timing of the toughest part of the four-year presidential equity market cycle and the coming April tax liquidity squeeze (when consumers and businesses pull cash out of the private financial system to pay taxes, temporarily tightening financial conditions). This is a lot for investors to chew on, and the most notable development we picked up last week was the growing nervousness among long-only investors, who had largely remained calm during the first four weeks of the conflict.
We also saw the equity market disconnect from Fed expectations last Friday. Until then, the S&P 500 had moved in lockstep with the Fed rate cut/hike expectations (i.e., stock market higher if rate cut odds were rising, and lower if rate hike odds were rising). But that de-coupled on Friday – stocks fell as rate cut odds rose – a sign to us that the S&P 500 is starting to worry more about a recession than an inflation shock.
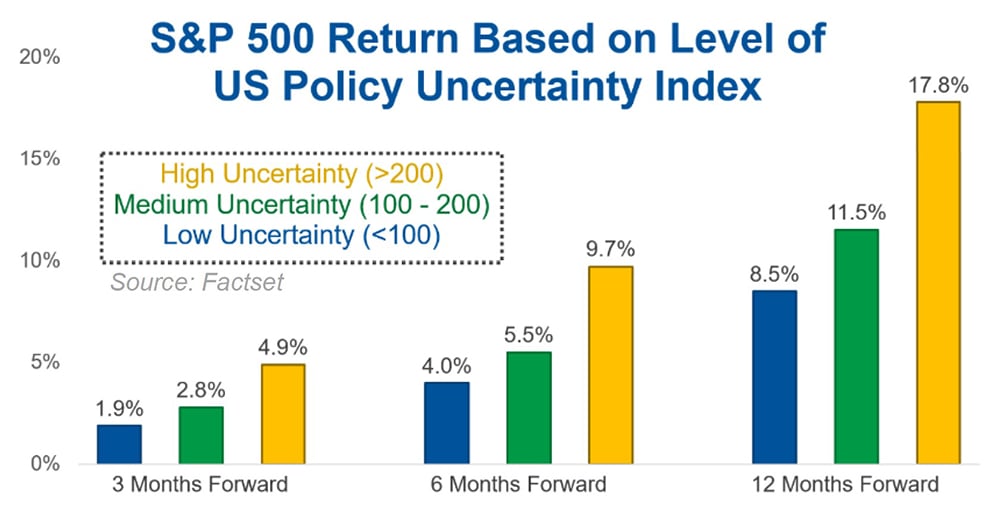
Not coincidentally, policy uncertainty is inching towards April 2, 2025 levels. Historically, this has been a contrarian indicator, with high levels of policy uncertainty associated with higher levels of equities over the ensuing 3-, 6-, and 12-month timeframes.
Outlook cloudier, but thesis intact. We set out this year with a view that seemed contradictory: shock-and-awe economic policy will lift economic growth, but equities will struggle as the gains from that growth were largely already priced into a market that was up double digits in the second half of 2025. Now, the Iran conflict threatens these economic gains. But, incredibly, the S&P 500 has tracked the historical averages of the presidential cycle quite closely, with the Iran conflict pulling forward the cycle by just 4-6 weeks. Interest rates have followed a similar trajectory. Historically, presidents stimulate the economy ahead of the midterm election – rates price this growth in, and it is usually those higher rates that are associated with the midterm equity market sell-off. Said another way, it is not a coincidence to us that the S&P 500 and 10-year yield look like their historical averages.
Important Disclosures
Past performance is not indicative of future results and diversification does not ensure a profit or protect against loss. All investments carry some level of risk, including loss of principal. An investment cannot be made directly in an index. Market and economic statistics, unless otherwise cited, are from data providers FactSet and Bloomberg.
This communication was prepared by Strategas Securities, LLC (“we” or “us”). Recipients of this communication may not distribute it to others without our express prior consent. This communication is provided for informational purposes only and is not an offer, recommendation or solicitation to buy or sell any security. This communication does not constitute, nor should it be regarded as, investment research or a research report or securities recommendation and it does not provide information reasonably sufficient upon which to base an investment decision. This is not a complete analysis of every material fact regarding any company, industry or security.
Additional analysis would be required to make an investment decision. This communication is not based on the investment objectives, strategies, goals, financial circumstances, needs or risk tolerance of any particular client and is not presented as suitable to any other particular client. Investment involves risk. You should review the prospectus or other offering materials for an investment before you invest. You should also consult with your financial advisor to assist you with your analysis, risk evaluation, and decision-making regarding any investment.
The performance and other information presented in this communication is not indicative of future results. The information in this communication has been obtained from sources we consider to be reliable, but we cannot guarantee its accuracy. The information is current only as of the date of this communication and we do not undertake to update or revise such information following such date. To the extent that any securities or their issuers are included in this communication, we do not undertake to provide any information about such securities or their issuers in the future. We do not follow, cover or provide any fundamental or technical analyses, investment ratings, price targets, financial models or other guidance on any particular securities or companies.
Further, to the extent that any securities or their issuers are included in this communication, each person responsible for the content included in this communication certifies that any views expressed with respect to such securities or their issuers accurately reflect his or her personal views about the same and that no part of his or her compensation was, is, or will be directly or indirectly related to the specific recommendations or views contained in this communication. This communication is provided on a “where is, as is” basis, and we expressly disclaim any liability for any losses or other consequences of any person’s use of or reliance on the information contained in this communication.
Strategas Securities, LLC is affiliated with Robert W. Baird & Co. Incorporated (“Baird”), a broker-dealer and FINRA member firm, although the two firms conduct separate and distinct businesses. A complete listing of all applicable disclosures pertaining to Baird with respect to any individual companies mentioned in this communication can be accessed at https://researchdisclosures.rwbaird.com/. You can also call 1- 800-792-2473 or write: Baird PWM Research & Analytics, 777 East Wisconsin Avenue, Milwaukee, WI 53202.