The Best Market Indicator Is…
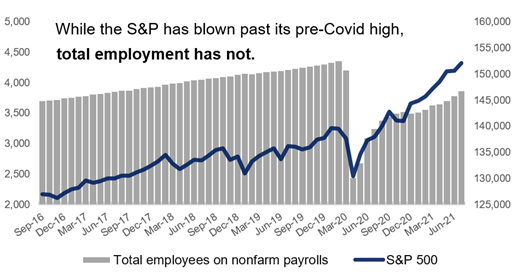
Take the economic ramifications of the coronavirus crisis. In April 2020, just weeks into the pandemic, the United States had shed roughly 22 million jobs (or 15% of the workforce – easily a modern record). Fourteen months later, the U.S. was still short about 6 million jobs. That figure is roughly a 4% drop from pre-crisis levels – which, for context, represents an employment crisis more severe than the recessions of 1981, 1990 or 2001 at their worst. Despite this, U.S. GDP sits at a record high, the stock market has doubled from its March 2020 low (hitting 50+ new all-time highs along the way) and corporate profits are soaring. Employment, a seemingly simple and reliable indicator of economic activity, is missing a big chunk of the economic picture.
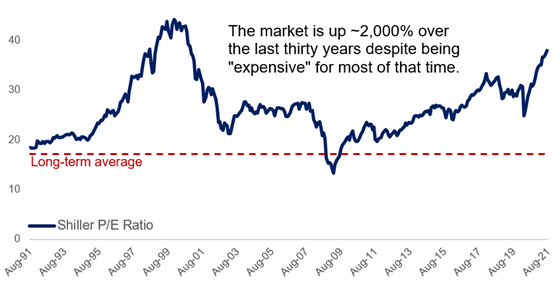
What about more explicit market indicators? Consider the Shiller P/E, a very popular valuation metric that measures the price of the S&P 500 against its last decade of earnings. Like all price multiples, the higher it is, the more “expensive” the market (i.e., the more one pays for a share of earnings). The Shiller P/E has been almost exclusively above (and often well above) its long-term average since 1990, signaling a market expensive relative to history – and a warning sign to investors. Despite this, the market is up over 20x across that same time frame. The Shiller P/E described an expensive market (and by extension, weaker future returns) for decades, but this indicator alone wasn’t enough to properly gauge the bigger picture.
This idea works in reverse, as well: Consider the stock market vs. the economy. While many might use the stock market level for a shorthand read on the economy, this can be highly flawed. The market is a forward-looking mechanism that discounts the probability of future events, while the economy is often backward-looking (when considering most data is weeks to months old by the time it is compiled and reported). Because of this (and many other key differences), the stock market is rarely an indicator of economic health – it can often be ascendant while the real world struggles, or it can languish amid economic strength. Again, simple indicators alone are not enough to wrangle highly complex systems.
The lesson here is not to discredit popular market indicators or important economic data, but rather to show that markets are complex beasts that require many inputs just to understand, much less forecast. It’s also a lesson to challenge our prior beliefs about how the markets and economy should work, especially as the world constantly evolves and changes around us.
This information has been developed by a member of Baird Wealth Solutions Group, a team of wealth management specialists who provide support to Baird Financial Advisor teams. The information offered is provided to you for informational purposes only. Robert W. Baird & Co. Incorporated is not a legal or tax services provider and you are strongly encouraged to seek the advice of the appropriate professional advisors before taking any action. The information reflected on this page are Baird expert opinions today and are subject to change. The information provided here has not taken into consideration the investment goals or needs of any specific investor and investors should not make any investment decisions based solely on this information. Past performance is not a guarantee of future results. All investments have some level of risk, and investors have different time horizons, goals and risk tolerances, so speak to your Baird Financial Advisor before taking action.