
Five for Friday
March 27, 2026
Energy, Rates, Capex, On This Day, and Also On This Day
1. Energy
Higher oil prices are typically a headwind for almost everyone except the energy companies who produce, refine, and distribute the product. Though the U.S. consumes less and produces more oil than we have in the past, higher energy prices are still a cost that often takes away from spending elsewhere for consumers and businesses. Which is why it was surprising to find out how well stocks have historically done in the aftermath of an oil shock. In our piece from earlier this month, we looked at various short-term spikes in crude oil prices – from the Gulf War in 1990 to the post-Covid pop in mid-2020 – and found that stocks have tended to be resilient amid energy shocks. A good reminder for investors here.
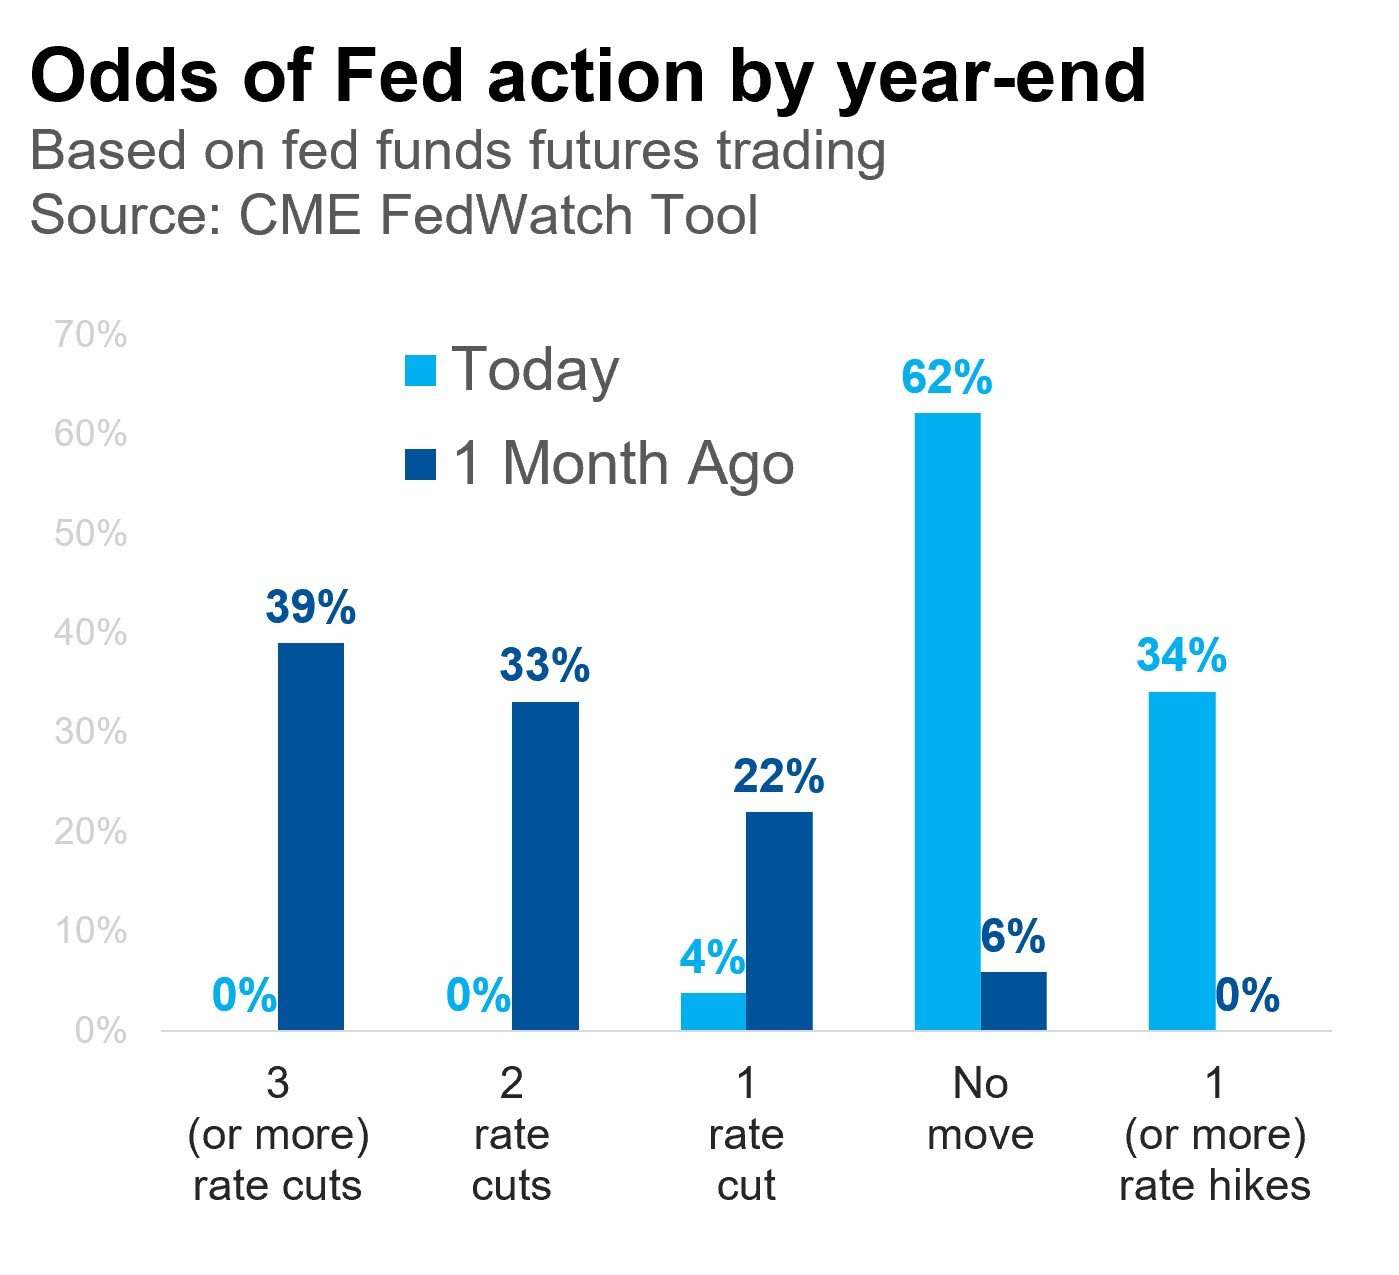
2. Rates
Aside from the move in oil, the most concerning economic ramification of the war in Iran is the rapid reorientation of the Federal Reserve’s next move and what it means for bond yields. Over the last month, investors have pivoted from asking, “how many times will the Fed cut interest rates this year?” to “will the Fed have to hike rates?” I’d argue that raising rates into the teeth of an energy shock (and with the labor market already unsteady) would be a policy mistake, but it hasn’t stopped markets from shifting their view (partly based on the potential for spring inflation data to look ugly). Long-term yields have followed suit, rising to six month highs on the potential that inflation will be stickier than has been hoped – a move that has been a bugaboo for stocks and rate-sensitive sectors in recvent years. Even if the U.S. and Iran enter a sustained deescalation path, energy prices seem likely to remain structurally higher for a time as a “war premium” is priced in and lost production takes a toll. There are plenty of reasons to remain bullish on stocks, but it’s hard to make the case that the prospect of interest rate cuts is still one of them.
3. Capex
We wrote last week about the stimulative and market-supporting impact of the consumer provisions in last year’s reconciliation bill (aka the OBBBA). And while the consumer-facing impacts of the bill are more immediately noticeable – i.e., tens of billions more in tax refunds vs. 2025 – the business-facing provisions may be more meaningful to overall growth. The bill was written to incentivize domestic spending and capital investment, with provisions like 100% immediate expensing of research and development costs. Data centers and other AI infrastructure have benefited because of their massive infrastructure needs, short-lived equipment, and large upfront spending on computing, cooling, etc. Data center construction is now outpacing general office construction, and while this is a boon for growth, it has also become a political hotbed. Our partners at Strategas (a Baird company) detail the state of play here.
4. On this day
in 2000, the dot com bubble peaked. It marked the end of a period of unprecedented market appreciation, in which the tech-heavy Nasdaq rose nearly 1,000% across a five-year period (including a speculative surge in which the index more than doubled in the bubble’s final seven months). Amid discussion of the bubble potential of the AI boom, it is worth revisiting just how crazy the late 1990s were for an example of what a true speculative asset bubble looks like.
5. Also on this day
in 1980, was “Silver Thursday,” a day marked by the sudden collapse of silver prices after the Hunt brothers (sons of oil tycoon H.L. Hunt) attempted and failed to corner the global silver market. After spending a decade amassing somewhere between one third and one half of the world’s silver, the brothers’ plan unraveled when prices stumbled and they were unable to meet their margin calls, leading to losses (in today’s dollars) of ~$7 billion. As ever, nothing turns a good idea into an abject disaster like too much leverage. But at least it inspired a classic movie.
Disclosures
This is not a complete analysis of every material fact regarding any company, industry or security. The opinions expressed here reflect our judgment at this date and are subject to change. The information has been obtained from sources we consider to be reliable, but we cannot guarantee the accuracy. Market and economic statistics, unless otherwise cited, are from data provider FactSet.
This report does not provide recipients with information or advice that is sufficient on which to base an investment decision. This report does not take into account the specific investment objectives, financial situation, or need of any particular client and may not be suitable for all types of investors. Recipients should not consider the contents of this report as a single factor in making an investment decision. Additional fundamental and other analyses would be required to make an investment decision about any individual security identified in this report.
For investment advice specific to your situation, or for additional information, please contact your Baird Financial Advisor and/or your tax or legal advisor.
Past performance is not indicative of future results and diversification does not ensure a profit or protect against loss. All investments carry some level of risk, including loss of principal. An investment cannot be made directly in an index.
Copyright 2026 Robert W. Baird & Co. Incorporated.
Other Disclosures
UK disclosure requirements for the purpose of distributing this research into the UK and other countries for which Robert W. Baird Limited holds an ISD passport.
This report is for distribution into the United Kingdom only to persons who fall within Article 19 or Article 49(2) of the Financial Services and Markets Act 2000 (financial promotion) order 2001 being persons who are investment professionals and may not be distributed to private clients. Issued in the United Kingdom by Robert W. Baird Limited, which has an office at Finsbury Circus House, 15 Finsbury Circus, London EC2M 7EB, and is a company authorized and regulated by the Financial Conduct Authority. For the purposes of the Financial Conduct Authority requirements, this investment research report is classified as objective.
Robert W. Baird Limited ("RWBL") is exempt from the requirement to hold an Australian financial services license. RWBL is regulated by the Financial Conduct Authority ("FCA") under UK laws and those laws may differ from Australian laws. This document has been prepared in accordance with FCA requirements and not Australian laws.