Key Research Takeaways from Baird Strategas
Baird Strategas shares its latest outlook on the markets, economy and investment landscape.
August 19, 2026
Investment Strategy
By: Jason Trennert, Chief Investment Strategist and Chairman
The market building blocks of employment, financial conditions and profits still tilt toward continuation of the bull market. Yet, forward progress for the S&P 500 might be made more difficult by Fed decisions, oil prices, questions about AI capital spending, and midterm elections.
- Spending boom. The capital spending boom associated with AI is likely to continue. The CEOs of the major players are at more career risk if they don’t invest heavily in AI and fail to participate in its growth, than if they do invest but lose money. The provisions of the One Big Beautiful Bill provide further incentives to keep spending. Cash flows may be the only constraint. It is popularly calculated that Microsoft, Amazon, Google, and Facebook will only have $4 billion in free cash flow by Q3. A greater reliance on debt and equity issuance may be necessary to sustain the growth in capital spending.
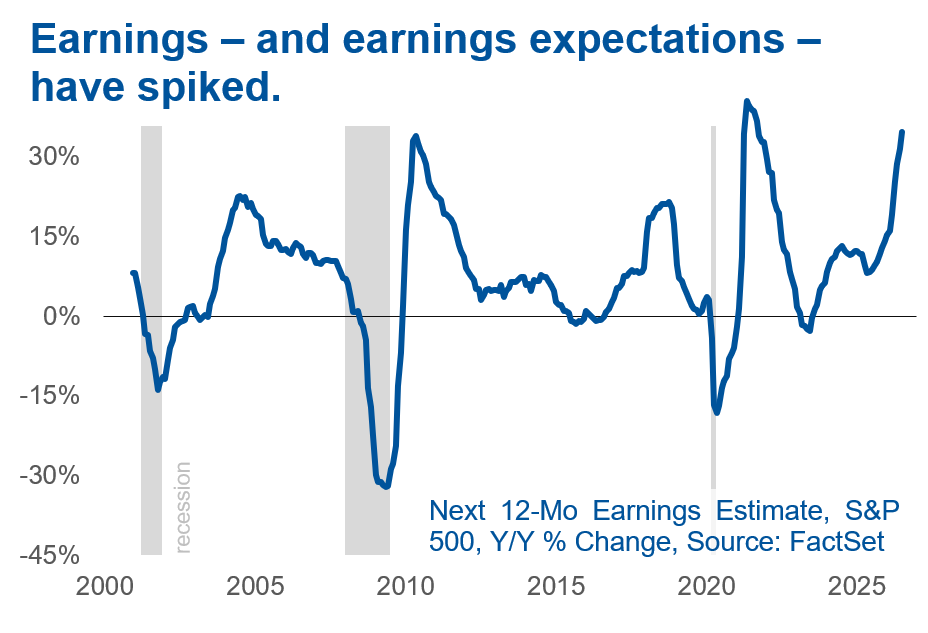
- Earnings soaring. Robust corporate profits are supportive of the bull run. Q2 S&P 500 profits are tracking to be +50% year over year. Profit growth should be double digits in 2027 but capital gains and tariff refunds will be hard to repeat.
- Rich valuations. The market is expensive by trailing P/E, forward P/E, EV/Sales, EV/EBITDA, Price/Book, and Price/Sales. However, strong earnings have led to multiple compression, and valuation tends to be a poor timing tool.
- AI vs. Iran. Excitement over AI is over-riding concerns about the war with Iran despite President Trump’s running commentary on the Strait of Hormuz and prospects for its opening.
- Risks. Incipient signs of inflation and the recent rise in 10-year Treasury yields are the biggest risks to the bull market. Over the past four years, a 10-year yield above 4.5% has meant a tougher environment for the market. Thus far, inflation expectations have barely budged.
- Investment themes. Our major themes remain 1) Cash Flow Aristocrats; 2) Artificial Intelligence; 3) the Industrial Power Renaissance; and 4) Deglobalization.
Asset Allocation
By: Nicholas Bohnsack, President and Head of Portfolio Strategy
We are watching global supply chains, inflation, and AI closely. We continue to include metals in our tactical allocations. Within equities we advise a measured rotation into more traditional Value corners of the market.
- Big questions. We are focused on three areas: 1) Is the Strait of Hormuz open and are global supply chains being fed at levels close to those seen prior to war in Iran? 2) Are inflationary pressures compounding or easing, and what action is being taken by global monetary policymakers? 3) Is there enough evidence of self-sustaining or scaled commercial applications of AI to resolve questions posed by the extreme readings of traditional fundamental barometers.
- Alternatives in focus. In recent years we increased exposure to Gold and precious/industrial metals with an Alternatives sleeve. Last November, we migrated to a 60/30/10 framework of stocks/bonds/alternatives. We believe an incremental approach to this shift is prudent given the impact on client portfolios (recent volatility in metals is case in point).
- Positioning dynamics. Our tactical conclusion is that the engine driving returns is changing. The next phase of the global equity cycle should favor companies that convert fiscal incentives, AI spending, defense budgets, energy scarcity, and infrastructure investment into cash flow (not solely companies whose valuations depend on multiple expansion). Growing instability beneath the index surface is troublesome. We recommend maintaining current levels of exposure but continue to reduce dependence on U.S. Mega-Cap Growth and advise measured rotation toward more traditional Value corners of the equity market and higher quality tranches within fixed income.
Economics
By: Don Rissmiller, Chief Economist
The U.S. has been resilient to numerous shocks. Despite cracks in the labor market, the latest data shows the unemployment rate (which balances labor supply and labor demand) declining in mid-2026.
- Growth. Fiscal stimulus for consumers has muted the impact of higher energy prices. If it were not for the conflict in Iran, we might be talking about a reaccelerating U.S. economy due to cyclical sectors (e.g., manufacturing) improving. The AI capital spending story is also a continued support. For 2026, we are using odds of 25% for U.S. recession, 65% for solid growth, 10% for upside surprise.
- Inflation. The last wave of inflation peaked in 2022. Longer-term inflation expectations still look anchored. But history suggests that a second wave of inflation tends to build (87% of the time globally). Given global supply-chain interruptions, we may be seeing the early signs of a second wave. We’ll watch domestic rents and wages to gauge the situation.
- Policy. The last few years saw lower monetary policy rates, justified first by inflation coming down and then reinforced by cracks in employment. The Fed has been on an extended hold amid uncertainty about both jobs and inflation. The textbook monetary policy response is to look beyond supply shocks, but that requires anchored long-term expectations for inflation. The hawks on the FOMC are getting agitated regarding that last point, and our base case is that policy will be tightened (+25bp) in December.
- Risks. The fiscal supports that have aided growth have not been cost-free. The U.S. federal budget deficit remains large and while there’s no emergency, threatens to crowd out other economic activity (this does not appear to be happening yet). Fixing this abruptly risks an economic stop. Alternatively, inflation could return over time if expectations become unanchored due to repeated shocks. The market would likely demand higher interest rates in that scenario.
- Hope. Productivity (more output per hour) can conceptually alleviate a second inflation wave. Too much money chasing too few goods can be solved by producing more goods. While there is promise from tech advances, we would like to see sustained profit growth for both the producers of a new technology (e.g., AI) and its users.
Technical and Market Strategy
By: Chris Verrone, Chief Market Strategist
The trend in global equities remains “up and to the right.” What began as a narrow melt-up this spring has gone broad. Share prices for 75% of S&P 500 stocks are above their 200-day moving average and the Russell 3000 advance/decline line confirms the new highs among the major indices.
- Rotation. This remains a highly rotational market – since the peak in the momentum factor on June 22, most sectors have strengthened internally, particularly Healthcare and Financials. Money is moving within equities rather than exiting the asset class – hinting to us that a 4.75% 10-year yield is not competitive enough to pull money away from stocks in a 6.5% nominal growth environment.
- Financials. We can’t think of too many times in our career when a backdrop like we have today—global Banks stocks in gear and credit conditions benign (fresh tights for BB/BBB spreads last week)—has coincided with the market being on the cusp of having a big problem. We expect any seasonal or pre-midterm weakness to remain controlled and corrective.
- Leadership. As the tape has emerged from the momentum unwind of June and July, pay attention to what is and is not reclaiming the baton of leadership. The percent of Semiconductor stocks trading at 20-day highs (about 20% earlier this month) suggests a split response. Notably, the Utilities remain weak and have migrated to the bottom of our sector rankings. We don’t expect any leadership resurgence here.
- Rates. The trend in global rates also remains up, but the velocity of the move is controlled… believe it or not, this is one of the narrowest 18-month ranges for the 10-year yield ever. So far, higher rates have not upset credit conditions or been met with defensive leadership (we get more worried when this is the case).
- Sentiment. The biggest risk we see is the one right in front of us: so goes price, so goes attitude. Expectations as expressed through the package of sentiment data is getting more aggressive. With the weekly bull/bear ratio nearly 4 to 1 (a top decile reading), we have to be alert to when the market stops validating the excitement.
- Surprises. Two items to put on the radar are 1) some of the “weak links” aren’t so weak anymore. Concern persists on the private credit / alternative asset managers, but they’re acting better, and 2) we see signs of life from “the bottom of the K” – namely, lots of restaurants of all sizes breaking out (this wasn’t the case in the 2021/2022 inflation period).
Washington Policy
By: Dan Clifton, Head of Policy Research
 Iran. The U.S. and Iran remain in a stalemate after the June memo of understanding fell apart. The president is looking to avoid military escalation ahead of the midterms to keep oil prices and inflation in check and to try to reverse negative polling numbers for Republicans. Iran sees the step-back as an opening to press for more demands and more control of the Strait of Hormuz. The administration will focus on applying economic pressure on Iran (maintaining the blockade is key) and resupplying munitions. We could be in a prolonged period of uncertainty with occasional skirmishes, but for now the market sees that the U.S. is seeking deescalation.
- Inflation and rates. Although the Strait of Hormuz may not be completely open, some oil is still moving through the U.S.-protected route near Oman. Military deescalation keeps a lid on oil prices, which will help to keep inflation down. That relieves pressure on the Fed and gives Chair Kevin Warsh more time to set up a two-step process: financial deregulation that then allows for reduction of the Fed balance sheet. We expect Jay Powell to remain at the Fed through at least the midterms to see whether Democrats win the Senate, which would limit who Trump could get confirmed. If Republicans keep the Senate, Powell may stay on the Board until the end of his term in January 2028.
- Midterms. With the president’s approval rating underwater, voters looking for change, and high voter turnout, Democrats are operating in a favorable environment. They need a net 3 seats to take control of the House and are poised to do so. In the Senate, they need to win a net 4 seats, which the market sees as more difficult after the party nominated progressive candidate Abdul El-Sayed in Michigan. However, Democrats are expanding the map and running competitive races in states that traditionally vote Republican, such as Texas, Iowa, and Ohio, creating parallels to 2006 when Republicans lost Senate seats in states President Bush had won in 2004.
ETF Research
By: Todd Sohn, Chief ETF Strategist
- Heavy inflows. The ETF ecosystem remains in full motion with over $2 trillion inflows and 900 new funds year-to-date. Both are well ahead of any historical precedents. Tactically, while July offered a reset for higher beta corners, flows showed no slowdown. Equity ETFs have averaged $6.5 billion per day since the June 2 market high, compared to sub-$3 billion during the March correction.
- Technology. Digging into the sector space, while corrective action reset High Beta relative Low Beta from its top decile of performance, this did not deter enthusiasm for Technology-related exposures. Tech ETFs have seen over $25 billion inflows since their recent high, nearly twice all other sectors combined. We would look to “low Tech / low correlation” areas such as Natural Resources, REITs, and the Low Volatility Factor to complement portfolios.
- Leverage. Keep a close eye on the resumption of levered activity. While Korean regulators tightened use of levered ETFs, U.S.-listed levered ETF notional value is again approaching $500 billion (a highwater mark). We suspect swap counterparties may begin to grow uncomfortable yet again (potentially soon).
- Where to? Away from leverage and Tech, the collapse of Beta for sectors such as Healthcare, Energy, and Financials is notable. Healthcare ETFs are seeing allocations return but are also coming off 3 years of heavy outflows. Energy flows have normalized following a spring sugar rush with the sector arguably a geopolitical hedge.
Fixed Income
By: Tom Tzitzouris, Head of Fixed Income Research
- Rinse and repeat. The Fed is getting closer to making a tightening move of some type in the next 4 months. At least that’s the market consensus, even after a weaker-than-expected jobs report and a relatively tame CPI print. These odds have come down in the last week, but the market still sees a hike coming before year-end. We’re not convinced a hike is coming, seeing it as more of a 50-50 bet (with, at worst, a slight bias towards a hike). This is important for bond markets between now and the next meeting, because if there’s any sign of an acceleration in inflation, the market is going to push up both short- and long-duration yields alike. This is one reason why we favor a slightly steeper curve from here. So Q3 is likely to be more about how expectations evolve rather than how the economy evolves, and unlike past periods, the bond market is going to have to set these expectations on its own – without the help of explicit forward guidance.
- Rates outlook. We favor minor steepening over the remainder of the year, with most of this move coming from reduced rate hike odds and lower term premia on the front end of the curve, rather than drastically higher long bond yields. For 10-year Treasury yields, we see a cap a smidge higher than current levels, around 4.80%, due in large part to our belief that a move to this level before midterms would trigger a Treasury response to push the yield lower. 20-year and 30-year yields have more flexibility to gravitate higher, but each of the long bond maturities will find the gravity of 10-year yields is still powerful enough to keep them tethered too. For the short end, we argue that one rate hike before year end is effectively a 50-50 bet, meaning that if the Fed delays or chooses not to move this year, 1-years through 3-years should give up a handful of basis points of yield, but not much more. Collectively, we’re left with a “weak bias lower” for the front end of the curve and a “weak bias higher” for the long end—and a resulting “weak bias towards a steeper curve”
- Credit spreads. Consistent with the stop-and-go economy over the next 12 months, we expect to see credit spreads wobble slightly higher between now and the end of 2026. Investment grade spreads should head slightly higher between now and year end, but with earnings growth still strong and the consumer still afloat, there’s only so much spreads can rise. In fact, any rise in spreads over the next 4 months is more likely to come from supply glut than from deteriorating credit quality, although 2027 may see more of both. High yield spreads are also likely to inch northwards this quarter, and a move back up to 300 basis points more likely than not, in our view. Here too, we suspect that spreads will be capped in both Q3 and Q4, but some portions of this space in weaker sectors and weaker balance sheets are likely to show growing distress, as represented by a bias towards a wider BB/CCC spread.
Definitions of valuation multiples mentioned: Trailing P/E: The company’s current stock price divided by its earnings per share over the last 12 months. It shows how much investors are paying for actual recent earnings. Forward P/E: The company’s current stock price divided by expected earnings per share over the next 12 months. It shows how much investors are paying based on projected future earnings.. EV/Sales: Enterprise value divided by revenue. This measures the value of the entire business relative to its sales. EV/EBITDA: Enterprise value divided by EBITDA (earnings before interest, taxes, depreciation, and amortization). This measures the value of the whole business relative to a common proxy for operating cash flow. Price/Book: Stock price divided by book value per share. It shows how the market values the company relative to its net assets on the balance sheet. Price/Sales: Stock price divided by sales per share. It shows how much investors are paying for each dollar of company revenue. All of these valuation multiples can also be applied to an index such as the S&P 500; in this case, the metric represents these statistics for all companies in the index in aggregate.
Important Disclosures
This communication was prepared by Baird Strategas LLC (“Baird Strategas” or “we”), a broker-dealer and FINRA member firm and SEC-registered investment adviser and edited and presented by Baird Private Wealth Management for its clients. We are affiliated with Strategas Asset Management, LLC, an SEC-registered investment adviser that leverages Baird Strategas analyses to manage and provide investment advice to client accounts and exchange-traded funds. We are also affiliated with Robert W. Baird & Co. Incorporated (“Baird”), a broker-dealer, FINRA member firm and SEC-registered investment adviser. Baird Strategas and Baird conduct separate and distinct businesses and maintain separate research departments.
This information is proprietary, and it and any portion hereof may not be copied, reprinted, forwarded, sold, redistributed or disclosed by the recipient or any third party, by content scraping or extraction, automated processing, or any other form or means, without the prior written consent of Baird Strategas or if required by law. Any unauthorized use is prohibited.
This communication is provided for informational purposes only and is not an offer, recommendation or solicitation to buy or sell any security. This communication does not constitute, nor should it be regarded as, investment research or a research report or securities recommendation and it does not provide information reasonably sufficient upon which to base an investment decision. This is not a complete analysis of every material fact regarding any company, industry or security. Additional analysis would be required to make an investment decision. This communication is not based on the investment objectives, strategies, goals, financial circumstances, needs or risk tolerance of any particular client and is not presented as suitable to any other particular client. The intended recipients of this communication are presumed to be capable of conducting their own analysis, risk evaluation, and decision making regarding their investments.
For recipients subject to MiFID II, UK MiFID laws or the rules of the UK Financial Conduct Authority, this communication is directed only at persons who are professional clients or eligible counterparties within the meaning of those rules. It is not directed at, and must not be relied upon by, retail clients. The contents of this material are provided for information purposes only and do not constitute investment advice, a personal recommendation or a recommendation to take any investment decision.
The performance and other information presented in this communication is not indicative of future results. Market and economic statistics, unless otherwise cited, are from data providers FactSet or Bloomberg. The information in this communication has been obtained from sources we consider to be reliable, but we cannot guarantee its accuracy. The information is current only as of the date of this communication and we do not undertake to update or revise such information following such date. To the extent that any securities or their issuers are included in this communication, we do not undertake to provide any information about such securities or their issuers in the future. We do not follow, cover or provide any fundamental or technical analyses, investment ratings, price targets, financial models or other guidance on any particular securities or companies. Further, to the extent that any securities or their issuers are included in this communication, each person responsible for the content included in this communication certifies that any views expressed with respect to such securities or their issuers accurately reflect his or her personal views about the same and that no part of his or her compensation was, is, or will be directly or indirectly related to the specific recommendations or views contained in this communication. This communication is provided on a “where is, as is” basis, and we expressly disclaim any liability for any losses or other consequences of any person’s use of or reliance on the information contained in this communication.
Despite the separation of businesses between Baird Strategas and Baird, to the extent this report mentions any specific companies or their securities, a complete listing of all research disclosures, including disclosures of material conflicts of interest (if any) involving Baird and the companies mentioned herein, can be accessed at https://researchdisclosures.rwbaird.com/.