
Five for Friday
June 5, 2026
Disruption, Bets, Iran, May, and On This Day
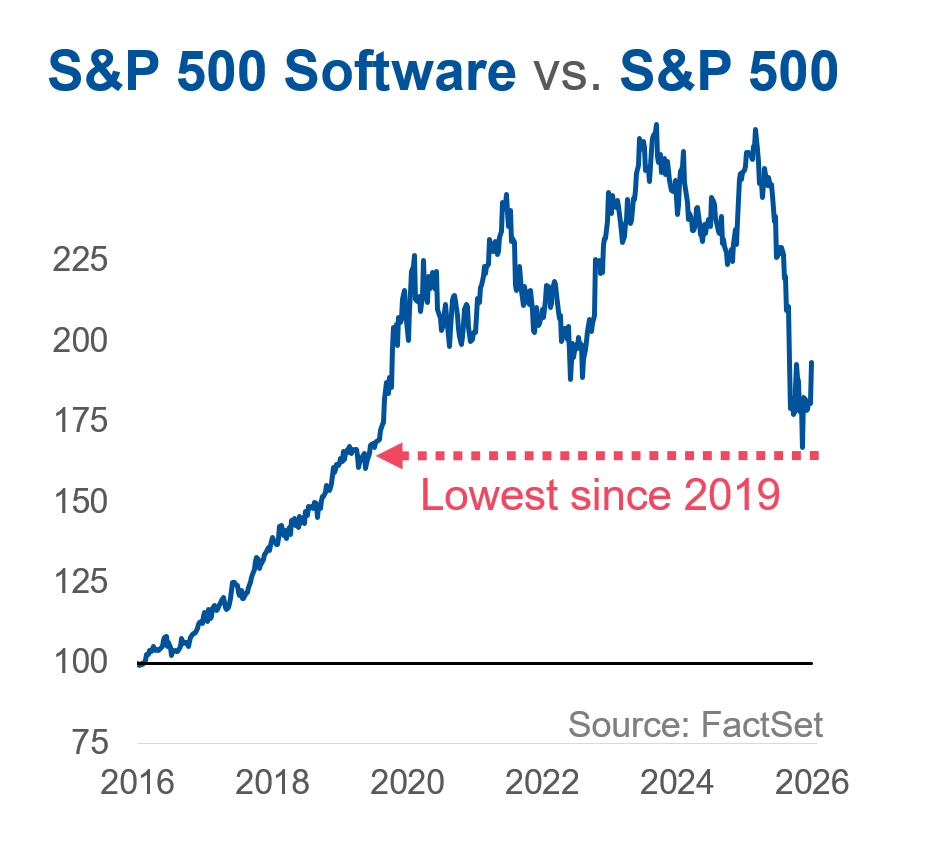
1. Disruption
In May, S&P 500 software stocks were up over 16% – their best month since 2002 – as better-than-expected earnings and positive corporate commentary on AI integration buoyed the sector. This is notable in large part because of the selloff that preceded it – software stocks were down ~35% near the end of March as investors dumped established companies on fears that AI is an existential threat. As we noted earlier this year, the market seemed to be assuming universal and swift technological disruption when an uneven and gradual shift could be just as likely (not to mention the possibility of a world in which AI enables software companies to do more and for a wider clientele). In a similar vein, the labor market’s resilience in recent months (solid private payrolls growth, historically low unemployment claims, and falling youth unemployment) followed predictions for immediate and existential AI disruption. As with many things, the AI debate often tilts toward extremes and is amplified by a media environment that tends to favor sensationalism. But reality (as usual) is somewhere in the boring, uncomfortable middle.
2. Bets
The World Cup kicks off next week, and analysts expect $2.9 billion will be bet on the event at U.S. sportsbooks, more than double the amount wagered in 2022. With gambling becoming omnipresent, we wrote on the topic here.
3. Iran
A lot of anxiety about the market today stems from the concern that stocks are ignoring the conflict in Iran and that ascent to all-time market highs amid rising inflation and ongoing turmoil is nothing more than blissful ignorance. But the market is not a monolith. The S&P 500 may be up 10% since gas prices began rising at the onset of the U.S.-Iran conflict, but the average Consumer Staples stock is down 12% and the average Consumer Discretionary stock is down 8%. The average Financial stock has also lost money as the odds of a 2026 rate hike have risen and the yield curve has flattened (banks “borrow” at short-term rates and lend at long-term rates, so a flatter yield curve squeezes profits). Said another way, while investors may still be too optimistic about a near-term resolution to the Iran conflict, the market has priced in some of the Iran fallout…it’s just being outweighed by the AI enthusiasm. That’s also why diversification is so essential – not because it helps investors avoid all pain, but because it helps keep any one pain point from doing all the damage.
4. May
The S&P 500 was up 11% through the first five months of the year, a historically encouraging signal. Since 1950, when the index is positive through May, the average return for the final seven months is 7.6%, (positive 81% of the time). By contrast, when it’s negative through May, the next seven-month average is -0.5%, and positive just 52% of the time.
5. On This Day
in 1975, the Suez Canal (a critical shipping route, then and now) reopened following an 8-year closure due to the Arab-Israeli Six-Day War. With hindsight, this proved was a good example of how shocks can reshape systems. The 1967 closure forced tanker routes around Africa, increasing distances and costs. This led to the rise of supertankers, which (over time) lowered per‑barrel transport costs through scale, and, along with new complementary infrastructure like pipelines, created a more resilient global energy network. Could Iran, with time, spur a similar change?
Disclosures
This is not a complete analysis of every material fact regarding any company, industry or security. The opinions expressed here reflect our judgment at this date and are subject to change. The information has been obtained from sources we consider to be reliable, but we cannot guarantee the accuracy. Market and economic statistics, unless otherwise cited, are from data provider FactSet.
This report does not provide recipients with information or advice that is sufficient on which to base an investment decision. This report does not take into account the specific investment objectives, financial situation, or need of any particular client and may not be suitable for all types of investors. Recipients should not consider the contents of this report as a single factor in making an investment decision. Additional fundamental and other analyses would be required to make an investment decision about any individual security identified in this report.
For investment advice specific to your situation, or for additional information, please contact your Baird Financial Advisor and/or your tax or legal advisor.
Past performance is not indicative of future results and diversification does not ensure a profit or protect against loss. All investments carry some level of risk, including loss of principal. An investment cannot be made directly in an index.
Copyright 2026 Robert W. Baird & Co. Incorporated.
Other Disclosures
UK disclosure requirements for the purpose of distributing this research into the UK and other countries for which Robert W. Baird Limited holds an ISD passport.
This report is for distribution into the United Kingdom only to persons who fall within Article 19 or Article 49(2) of the Financial Services and Markets Act 2000 (financial promotion) order 2001 being persons who are investment professionals and may not be distributed to private clients. Issued in the United Kingdom by Robert W. Baird Limited, which has an office at Finsbury Circus House, 15 Finsbury Circus, London EC2M 7EB, and is a company authorized and regulated by the Financial Conduct Authority. For the purposes of the Financial Conduct Authority requirements, this investment research report is classified as objective.
Robert W. Baird Limited ("RWBL") is exempt from the requirement to hold an Australian financial services license. RWBL is regulated by the Financial Conduct Authority ("FCA") under UK laws and those laws may differ from Australian laws. This document has been prepared in accordance with FCA requirements and not Australian laws.